RF2IQ I/Q demodulation of RF data
RF2IQ demodulates the radiofrequency (RF) bandpass signals and returns the Inphase/Quadrature (I/Q) components.
Contents
Syntax
IQ = RF2IQ(RF,Fs,Fc) demodulates the radiofrequency (RF) bandpass signals and returns the Inphase/Quadrature (I/Q) components. IQ is a complex whose real (imaginary) part contains the in-phase (quadrature) component.
- Fs is the sampling frequency of the RF signals (in Hz),
- Fc represents the center frequency (in Hz).
IQ = RF2IQ(RF,Fs) or IQ = RF2IQ(RF,Fs,[],...) calculates the carrier (center) frequency.
IMPORTANT: Fc must be given if the RF signal is undersampled (as in bandpass sampling).
[IQ,Fc] = RF2IQ(...) also returns the carrier (center) frequency (in Hz).
Note on fractional bandwidth
RF2IQ uses a downmixing process followed by low-pass filtering. The low-pass filter is determined by the normalized cut-off frequency Wn. By default Wn = min(2*Fc/Fs,0.5). The cut-off frequency Wn can be adjusted if the fractional bandwidth (in %) is given:
IQ = RF2IQ(RF,Fs,Fc,B)
The fractional bandwidth (in %) is defined by:
B = Bandwidth_in_% = Bandwidth_in_Hz  (100/Fc).
When B is an input variable, the cut-off frequency is calculated as follows:
Wn = Bandwidth_in_Hz / Fs, i.e:
Wn = B (Fc/100)/Fs.
Other syntax
An alternative syntax for RF2IQ is the following:
IQ = RF2IQ(RF,PARAM)
where the structure PARAM must contain the required parameters:
- PARAM.fs: sampling frequency (in Hz, REQUIRED)
- PARAM.fc: center frequency (in Hz, OPTIONAL, required for undersampled RF signals)
- PARAM.bandwidth: fractional bandwidth (in %, OPTIONAL)
- PARAM.t0: time offset (in s, OPTIONAL, default = 0)
Additional notes
- NOTE #1: Undersampling (sub-Nyquist sampling)
If the RF signal is undersampled, the carrier frequency Fc must be specified. If a relative bandwidth (B or PARAM.bandwidth) is given, a warning message appears if harmful aliasing is suspected.
- NOTE #2: Dimensions
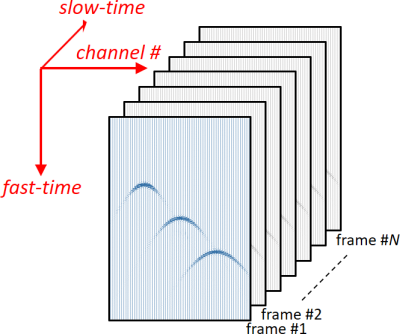
RF2IQ treats the data along the first non-singleton dimension as vectors, i.e. RF2IQ demodulates along columns for 2-D and 3-D RF data. Each column corresponds to a single RF signal over (fast-) time. Use IQ2RF to recover the RF signals.
- NOTE #3: Method
RF2IQ multiplies RF by a phasor of frequency Fc (down-mixing) and applies a fifth-order Butterworth lowpass filter using FILTFILT:
IQ = RF.*exp(-1i*2*pi*Fc*t);
[b,a] = butter(5,2*Fc/Fs);
IQ = filtfilt(b,a,IQ)*2;
Example #1: Envelope of an RF signal
This example shows how to obtain the real envelope of an RF signal by I/Q demodulation
Load an RF signal sampled at 20 MHz.
load RFsignal@20MHz.mat
Demodulate by using RF2IQ.
Fs = 20e6; % sampling frequency (in Hz)
[IQ,Fc] = rf2iq(RF,20e6);
disp(['The center frequency is ' num2str(Fc*1e-3,'%.1f') ' kHz.'])
The center frequency is 4936.4 kHz.
Calculate the real envelope.
RE = abs(IQ);
Display the RF signal and its envelope.
t = (0:numel(RF)-1)/Fs*1e6; % time (in microseconds)
plot(t,RF)
set(gca,'YColor','none','box','off')
xlabel('[\mus]')
hold on
plot(t,RE,'Linewidth',1.5)
hold off
axis tight
legend({'RF signal','Real envelope'})

Example #2: Demodulation of an undersampled RF signal
This example illustrates the I/Q demodulation of an undersampled RF signal.
Load an RF signal sampled at 20 MHz (center frequency: 5 MHz).
load RFsignal@20MHz.mat
Fc = 5e6; % center frequency (in Hz)
Fs = 20e6; % sampling frequency (in Hz)
Demodulate the original RF signal.
IQ = rf2iq(RF,Fs,Fc);
Create an undersampled RF signal (sampled at Fs/5 = 4 MHz).
factor = 5; % undersampling factor
usRF = RF(1:factor:end);
usFs = Fs/factor; % (under)sampling frequency
Demodulate the undersampled RF signal.
usIQ = rf2iq(usRF,usFs,Fc);
Display the original RF signal and its envelope.
t = (0:numel(RF)-1)/Fs*1e6; % time (in microseconds)
plot(t,RF,t,abs(IQ))
set(gca,'YColor','none','box','off')
title('RF signal sampled at 20 Mhz')
xlabel('[\mus]')
legend({'RF signal','Real envelope'})

Display the undersampled RF signal and its envelope.
t = (0:numel(usRF)-1)/usFs*1e6; % time (in microseconds)
plot(t,usRF,'.-')
hold on
plot(t,abs(usIQ),'LineWidth',1.5)
hold off
set(gca,'YColor','none','box','off','XAxisLocation','top')
xlabel('[\mus]')
title('RF signal sampled at 5 Mhz')
legend({'undersampled RF signal','Real envelope'})

See also
Reference
- Madiena C, Faurie J, Porée J, Garcia D. Color and vector flow imaging in parallel ultrasound with sub-Nyquist sampling. IEEE Trans Ultrason Ferroelectr Freq Control, 2018;65:795-802. (PDF)
About the author
Damien Garcia, Eng., Ph.D.
INSERM researcher
Creatis, University of Lyon, France
websites: BioméCardio, MUST
Date modified